Tuesday, September 16, 2014

Regression Analysis

Regression

Meaning 

Regression is the study of the nature of relationship between the variables so that one may be able to predict the unknown value of one variable for a known value of another variable.

Comparison between Correlation and Regression

  1. Correlation study the degree of relationship between variables while the regression study the nature of relationship between variables. 
  2. Correlation need not imply cause and effect relationship between variables whereas regression implies cause and effect relationship between variables.
  3. There may be non-sense correlation between variables whereas in case of regression there is nothing like non-sense regression.
  4. The correlation coefficient is independent of change of origin and scale but regression coefficients are independent of only change of origin but not of scale.
  5. Correlation coefficient cannot be used for prediction. But regression lines are used for prediction.

Two lines of regression

Two lines of regression
There are two lines of regression for two variables 'x' and 'y'.

Regression  equation of line Y on X

When we try to depict the change in 'y' for a given change in 'x', then the regression line of y on x is used.
The regression equation of y on x is given by
y-ybar = byx (x-xbar)
Where  byx = Cov(x,y)/Var(x)
byx is called the regression coefficient of y on x.

Regression equation of line X on Y

When we try to depict the change in 'x' for a given change in 'y'. then the regression line of x on y is used
The regression equation of x on y is given by
x-xbar = bxy(y-ybar)
Where bxy= Cov(xy)/Var(y)
bxy is called the regression coefficient of x on y

Relation between correlation and regression coefficient 

  • byx.bxy = r^2 

This implies that multiplication of both regression coefficient is equal to the square of correlation coefficient and the value of r^2 lies between 0 and 1
  • Correlation coefficient is geometric mean of both regression coefficients i.e. 

r = +/- square root( byx. bxy)


To get telephonic coaching of Correlation and Regression analysis click here

To preview of Correlation, Regression and Time series analysis e-book click here


Monday, September 15, 2014

Measures of Correlation

Measures of Correlation

Measures of Correlation
There are several method of measuring correlation between two or more variables. Some of them are mention here under.

Scatter Diagram

Scatter diagram is most popular and easy way of deciding the relation between two variables. It is a graphical method and ascertain the direction of correlation between two variables. To construct the scatter diagram take independent variable on X-Axis and dependent variable on Y Axis. Plot the graph of intersection points of two variables and decide the relation according to the scatter plot.
  1. If all the points fall on a straight line moving from left lower corner to right upper corner then it is the perfect positive correlation.
  2. If all the points fall on a straight line moving from upper left corner to right lower corner then it is a perfect negative correlation. 
  3. If all the points scattered nearby around the line then this will be high or low degree of positive and negative correlation according to the direction of line.
  4. If all the points scattered every where on the graph and no pattern will be identified then there is no correlation between the variables.

Karl Pearson's Coefficient of correlation

Scatter diagram is a graphical method of finding the correlation between two variables but it does not give the algebraic value of correlation between two variables. This become the drawback of the scatter diagram method. To overcome this Karl Pearson suggested a quantitative method of measurement of correlation which is known as the Karl Pearson coefficient of correlation denoted by (r). This gives the degree of correlation between the variables. Karl Pearson suggested the following methods to measure the coefficient of correlation. 

Deviation Method

In this method first the deviation of each variable is find out from its mean value i.e. if X and Y are two variable then the deviations are (X-Xbar) and (Y-Ybar). Now find the sum of the multiplication of the deviation. Then divide this sum by square root of sum of the square of the deviation of each variable. 

Product Moment Method

Different from deviation method the product moment method is treated the actual values of the variables multiplying the sum of the product of individual value of the variable by the number of variables and subtracting product of sum of individual values of variables. Divide this value by {square root (N. sum of square of X-square of sum of X). square root(N.sum of square of Y-square of sum of Y)}

Variance-Covariance method

In this method to find the coefficient of correlation formula of covariance and variance is used.

Spearman's Rank Correlation

Karl Pearson coefficient of correlation deal with quantitative data. But it doesn't suggest the method of treating the qualitative data. Here Spearman's Rank correlation works. This method used to find the coefficient of correlation when qualitative data is given like beauty, intelligence, sincerity, etc. There are three types of cases in Spearman's Rank Correlation method

When Ranks are given

In this case ranks have given for the qualitative data. To get the coefficient of correlation in this method we need to find the difference between the ranks then squared. Now find the sum of this squared quantities.
The formula used is
R=1-{6. Sum of D^2/(N^3-N)}
Where 'D' is difference of Ranks

When Ranks are not given 

In this case, we need to assign the ranks. Rank first is given to highest one and so on. After ranking, proceed as in the case of given ranks method.

When equal of tied ranks 

In this case calculate the average of same rank and assign this average rank to all the equal cases. Calculate a correction factor which will added in the formula as many times as the number of equal cases.

To get telephonic tutorial on Measures of correlation click here 


Thursday, September 11, 2014

Correlation Analysis

Correlation Analysis

Meaning

The correlation refers to the statistical technique used in measuring the closeness of the
Correlation Analysis
relationship between variables. e.g.
  • Price of the commodity rises as the demand for the commodity goes up.
  • Weight of a person increases with the increase in age.
  • Temperature rises with the rise in the sun light.

Definitions

  • "Correlation analysis deals with the association between two or more variables"..............Simpson and Kafka
  • "If two or more quantities vary in sympathy, so that movement in one tend to be accompanied by corresponding movements in the other, then they are said to be correlated"...................................... Conner
  • "Correlation analysis attempts to determine the degree of relationship between variables"............... Ya-Lun Chou

Uses of Correlation

  • With the help of correlation analysis, we can measure the degree of relationship in one figure between different variables like supply and price,. Income and expenditure, weight and volume manufacturing in an industry and so on..
  • We can estimate the value of one variable on the basis of the value of another,. This function is performed by regression analysis, which is based on correlation. 
  • A trader makes the estimation of costs, sales, prices etc. with the help of correlation and makes appropriate plans. 

Types of correlation

Positive Correlation

If two variables X and Y moves in same direction i.e. if one rises, other rises too and if one decline, other also decline then it is called a positive correlation e.g. money and supply

Negative Correlation

If two variables X and Y move in opposite direction i.e. if one rises, other fails, and if one fails other rises, then it is called as negative correlation e.g. demand and price.

Simple correlation 

When we try to find the relation between two variables then it is called simple correlation.

Partial correlation

Correlation among three or more variables is the study of two variables taking one variable as constant.

Multiple Correlation: 

Multiple correlation is the study of relationship among three or more variables under different conditions.

Linear Correlation 

Linear correlation is refers to the relationship between two variables such as the ratio of two variables remains constant throughout. It is best described by straight line.

Curvilinear Correlation 

It refers to the amount of change in one variable does not bear a constant ratio to the amount of change in the other variable. e.g. when every time X rises by 10%, then Y rises by 20% sometimes and sometimes by 10% and sometimes by 40% then there is no straight line relationship exist between two variable rather a curve like relation exit between the variable and it is called as curvilinear correlation. 

Degree of Correlation

The degree of correlation is expressed by the Karl Pearson's Coefficient of Correlation denoted by (r). The numerical value of (r) always between -1 and +1. On the basis of the value of (r) the Correlation has following degree of correlation.

Perfect Correlation

When the value of (r) comes -1 or +1 then it is called perfect positive or perfect negative correlation,

High Degree of Correlation

When the value of (r) comes in between either +0.75 to +1 or -0.75 to -1 then the correlation is called High degree of positive correlation or High degree of negative correlation.

Moderate Degree of Correlation 

When the value of (r) comes in between either +0.25 to +0.75 or -0.25 to -0.75 then the correlation  is called Moderate degree of positive and negative correlation.

Low degree of Correlation

When the value of (r) comes in between either 0 to +0.25 or 0 to -0.25 then the correlation is called Low degree of positive and negative correlation. 

Absence of Correlation 

When there is no correlation between the variables then the value (r) comes zero and this situation is called absence of correlation.


To get telephonic tutorial of Correlation Analysis click here


Wednesday, September 10, 2014

Standard Deviation


Standard Deviation

Calculation of Standard dispersion
Calculation of Standard deviation
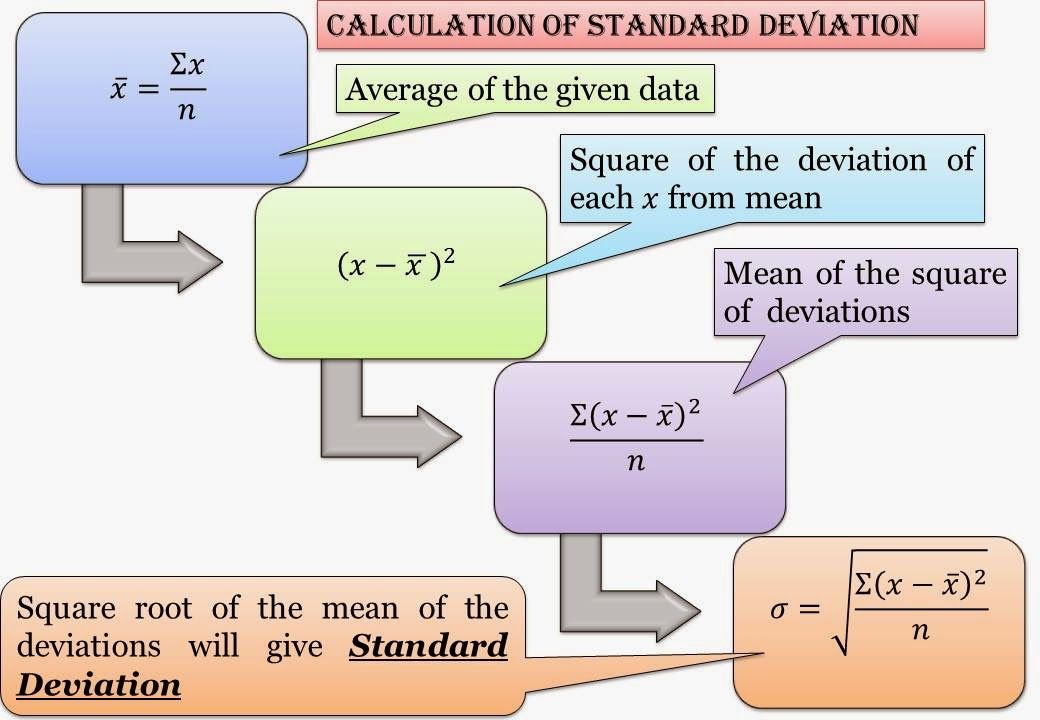
Standard deviation is defined as the square root of the arithmetic mean of the squares of the deviation of the values taken from the mean. It is denoted by small Greek letter read as ''sigma''. 

Calculation of standard deviation can understand by the fig. and mentioned below 

let 

X = X1, X2, X3, X4, ............................Xn

Xbar = (Sum of All Xn)/n
Now calculate the square of the deviation from each X from Xbar and then  calculate the mean of square of the deviations given as 
Sum(Xn-Xbar)^2/n
Now find the square root of this value and find the standard deviation of the data

Hence Standard deviation= square root(Sum(Xn-Xbar)^2)/n

Population Standard deviation

When sum of square deviation is divided by n then it is the population standard deviation

Sample Standard deviation

When sum of square deviation is divided by (n-1) then it is the sample standard deviation.

Difference between Mean deviation and standard deviation

  1. Algebraic signs of deviations (+/-) ignored while calculation mean deviation whereas in the calculation of standard deviation signs of deviations are not ignored i.e. they are taken into account .
  2. Mean deviation can be computed either from mean , median or mode. The standard deviation, on the other hand , always computed from the mean because the sum of the squares of the deviations taken from the mean is minimum.
To get Telephonic tutorials and e-book of Quantitative Techniques measure of dispersion click here


APQP Training