With the rising number of day-to-day problems in manufacturing and service organizations, the demand for employees skilled with problem-solving tools (7QC Tools) is also increasing to solve the problems continuously for the smooth operation of the organization and to achieve operational excellence in every corner of the organization.
Hence the employees skilled with the application of 7 QC Tools become the preferred choice in all kinds of manufacturing and service organizations.
So, here the opportunity is just a click away from you.
Buy Now! this eBook and be the master of the application of 7 QC Tools under various continuous improvement methodologies like Six Sigma DMAIC, SPC, PDSA/PDCA, KAIZEN, TPM, TQM, for problem-solving.
"The bestseller among quality professionals provides you a great self-training opportunity"
eBook Specifications:-
- Preview
- eBook Format: PDF
- Language: English
- Categories: 7 QC Tools, Lean Six Sigma, Total Quality Management
- File Size: 5MB
- Pages: 86
- Orientation: Landscape
- Facilitator/Author: Narender Sharma
Salient Features:-
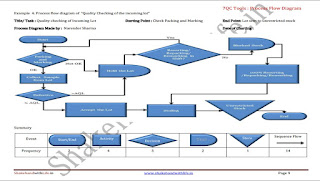
- Using this book you will learn and apply the 7 basic tools of quality effectively under various continuous improvement methodologies like Six Sigma DMAIC, SPC, PDSA/PDCA, KAIZEN, TPM, TQM, for problem-solving to achieve operational excellence. Using this book you will understand the way to draw a PROCESS FLOW CHART to identify the value-added and non-value added activities in an actual process step-by-step with colorful graphics and you'll also learn how to calculate the process efficiency for the given process. A process flow chart helps to identify the problem in the process that reduces the efficiency of the process and hence impacts the output of the process.
- Using this book You will get how to prepare a CHECK SHEET step-by-step with an example, and the use of a check sheet for data collection for defects and defectives. Check sheet gives you a clear picture of the problem in numerical form and helps you to make a better decision to move on in the direction of problem-solving.
- Using this book you will train yourself to draw the HISTOGRAM step-by-step with colorful graphics and Excel commands both manually and in excel for grouped and ungrouped data. The histogram helps to understand the symmetry of the data, the spread of the data, and the concentration of most of the data points and identify the gap between the average of the data points and the target value.
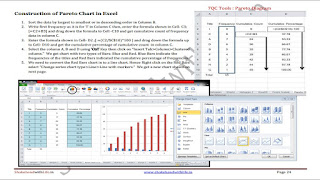
- Using this book you will catch the method to draw a PARETO CHART both manually and in excel step-by-step through the colorful graphics and Excel commands with an example problem and sample data. You will understand how to prioritize the 20% vital few items responsible for 80% of the problem using the Pareto chart. The Pareto chart helps to target the vital few causes to reduce the 80% impact of the problem.
- Using this book, you will find out the way to draw the CAUSE AND EFFECT DIAGRAM also known as the FISHBONE DIAGRAM or ISHIKAWA DIAGRAM step-by-step. The Cause and Effect diagram helps to identify the possible causes of the problem and so to predict the potential causes of the problem leading towards the root cause of the problem.
- Using this book, you will learn the way to draw the SCATTER CHART both manually and in Excel step-by-step with colorful graphics and Excel commands with example problems along with sample data. A Scatter chart establishes the relationship between the independent variable (the cause) and dependent variables (the effect) such as perfect positive correlation, or perfect negative correlation. You will also learn the way to calculate the value of the relationship between independent and dependent variables given by the coefficient of correlation denoted by 'r'.
- Using this book, you will coach yourself to draw the CONTROL CHARTS such as MEAN CHART and RNAGE CHART both manually and in Excel with example problem with sample data through the colorful graphics and Excel commands. You can use the control charts to control the process within control limits, specifically, the mean chart is used to maintain the accuracy and the range chart is used to maintain the precision of the data. The concept of accuracy and precision is also be elaborated using the Bow-Arc analogy.
- Using this book you will prepare yourself to face any interview for junior, middle, and senior-level positions, and you can answer any question based on the application of 7 QC Tools for problem-solving with full confidence and without any hesitation.
- The eBook provides you the opportunity to practice the use of QC tools with help of a project and practice problems with a test paper of 60 multiple-choice questions with an answer key.
- In this book, You will also have the introduction of the 5S methodology and kaizen to enhance your knowledge base.
Content Outlines:-
Section1: Introduction of 7 QC Tools
- Development
- Usages
- Application
- Expertise
Section2: Tool#1-Process Flow Chart
- What is a process flow diagram?
- Application and usages of process flow diagram
- Symbols used to make a process flow diagram
- Steps to construct a process flow diagram
- Illustrative practical examples
- Measuring cycle time
- Process efficiency
Section3: Tool#2-Check sheet
- What is a check sheet?
- Application and usages of check sheet
- Steps to construct a check sheet
- Illustrative practical examples
Section4: Tool#3-Histogram
- What is a Histogram?
- Analysis of different shapes of a histogram
- Application and usages of a histogram
- Steps to construct a histogram for ungrouped data
- Steps to construct a histogram for grouped data
- Illustrative examples
- Steps to construct a histogram in Excel
Section5: Tool#4-Pareto Chart
- What is a Pareto chart?
- About Alfredo Pareto?
- ABC analysis and 80-20 rule
- Application and usages of Pareto chart
- Steps to construct a Pareto chart
- Steps to construct a Pareto chart in Excel with excel commands and graphics
- Illustrative examples
Section6: Tool#5-Cause and Effect diagram
- What is a Cause and Effect Diagram?
- Application and usages of C&E diagram
- Steps to construct a Cause and Effect diagram?
- Illustrative Examples
Section7: Tool#6-Scatter Diagram
- What is a Scatter Diagram?
- Application and usages of scatter diagram?
- Interpretation of different patterns of scatter diagram e.g. Perfect positive correlation, Perfect negative correlation, high degree of positive correlation, high degree of negative correlation
- Correlation coefficient (Algebraic value of a relationship between two variables)
- The formula for the Correlation coefficient
- Steps to calculate correlation coefficient 'r'
- Interpretation of correlation coefficient 'r'
- Steps to construct a scatter diagram
- Steps to construct a scatter diagram in Excel
- Illustrative examples
Section8: Tool#7-Control Charts
- What is Control Chart?
- Types of control charts
- Concept of accuracy and precision
- Application and usages of control charts
- Impact on quality by continuous use of control charts
- Steps to construct a mean chart
- Steps to construct a mean chart in Excel
- Steps to construct a range chart
- Steps to construct a range chart in Excel
- Illustrative examples
Section9: Practice Problems and Project work
Section10: Self-assessment Exercise with 60MCQs
Section11: Introduction of KAIZEN
Section12: Introduction of 5S Methodology
About The Facilitator/Author
- Author (Narender Sharma) is a coach and consultant of Quality Excellence and Lean Six Sigma.
- Earned 20 years of cross-industry experience including 13years of strong working experience as a quality professional in 'In-process inspection' in Hindusthan National Glass and Ind. Ltd. (HNG) since 2001-2014
- MBA Production and Operation Management
- B.Sc. Electronics, B.Ed


2 comments:
شركة تنظيف بالدمام
شركة تنظيف افران بالاحساء
شركة تنظيف مكيفات بالاحساء
شركة تنظيف سجاد بالاحساء
شركة تنظيف فرشات بالرياض
شركة تنظيف استراحات بالرياض
شركة تنظيف ثريات بالرياض
شركة تنظيف محلات بالرياض
شركة تنظيف ستائر بالرياض
شركة تنظيف جلسات بالرياض
Post a Comment